
Chatbot KPI and Metrics: A Practical Framework for Measuring Success

• 31 min
I'm a content specialist at Fively keen on writing fresh articles that can help out business and tech specialists. I love to conduct research, hold interviews, and spotlight sophisticated tech issues.
A chatbot can answer thousands of messages, respond in seconds, and keep most conversations away from a human agent. None of those facts prove that it is successful.
High conversation volume may mean that customers like the chatbot, but it may also mean that they cannot find information elsewhere. This is why a useful measurement system must separate a chatbot KPI from a supporting metric. KPIs show whether the chatbot contributes to an important business outcome. Standard metrics explain how the chatbot behaves and help a product, support, sales, or AI team understand why a KPI is moving.
The distinction becomes even more important with generative AI, retrieval-augmented generation (RAG), and AI agents. This guide explains how to select important metrics by use case, calculate the most important chatbot performance metrics, set realistic benchmarks, instrument the necessary data, and build a dashboard that connects operational behavior to customer and business value.
What Are Chatbot KPIs and How Are They Different From Metrics?
A chatbot metric is a measurable observation about the chatbot, its users, or the surrounding workflow. Examples include conversation volume, fallback rate, response latency, escalation rate, token consumption, and survey participation.
A chatbot KPI, or key performance indicator, is a metric or a combination of metrics selected to evaluate progress toward a defined business goal. A KPI normally has five additional properties:
- A business objective it supports.
- A clearly defined calculation.
- A target or guardrail.
- An owner responsible for acting on it.
- A review period or decision cadence.
All KPIs are metrics, but most metrics are not KPIs.
For example, fallback rate is usually a diagnostic metric. It tells the conversational AI team how often the bot cannot produce an acceptable response. It becomes a KPI only when understanding coverage is a strategic objective, a target has been defined, and a team is accountable for improving it.
Similarly, chatbot conversion rate may be a primary KPI for a lead-generation bot but only a secondary metric for a customer support bot. The number itself is not inherently “key.” Its importance depends on what the chatbot is supposed to accomplish.
A good measurement model uses both. Leadership may need three to five KPIs, while the team operating the bot may track dozens of supporting metrics. The operational metrics explain whether a KPI changed because of traffic mix, knowledge gaps, poor retrieval, slow tools, confusing conversation flow, or an attribution error.
The most common mistake is to promote an easy-to-measure activity metric to KPI status. “The chatbot handled 50,000 conversations” sounds impressive, but it does not show whether users completed tasks, avoided repeat contacts, purchased products, or saved employee time. Volume needs an outcome attached to it.
Choose KPIs to Track Based on What Your Chatbot Is Supposed to Do
There is no universal set of chatbot success metrics to measure. The right KPIs depend on the job assigned to the bot, the users it serves, the systems it can access, and the consequences of a wrong answer.
Start by writing one sentence that defines the chatbot’s purpose. For example:
The chatbot should resolve common order and account questions without reducing customer satisfaction or making human support harder to access.
That sentence creates an outcome, a scope, and a guardrail. It also prevents the team from optimizing containment at any cost.
Customer Support Chatbots
A customer support chatbot should reduce support workload while helping users reach an accurate resolution with reasonable effort. Its KPI set must therefore balance automation, resolution quality, customer experience, and cost.
The most useful support KPIs usually include:
- First contact resolution for chatbot-eligible issues.
- Verified containment or automation rate.
- Ticket deflection compared with a pre-launch baseline.
- Cost per resolved conversation.
- Customer satisfaction by intent and outcome.
- Repeat contact or ticket reopen rate.
Fallback rate, latency, escalation reason, knowledge coverage, and conversation length support these KPIs. They help the team find the source of a problem but are rarely sufficient evidence of business success on their own.
Do not treat escalation as a failure by default. A medical, financial, account-security, cancellation, or emotionally sensitive request may require a human by design. The correct KPI is not “zero escalations.” It is successful self-service for eligible requests and safe, context-rich handoff for requests that need an agent.
Sales and Lead Generation Chatbots
A sales chatbot exists to create qualified commercial opportunities, not merely to collect contact details. Measuring only the number of captured emails can reward aggressive forms, low-quality leads, and conversations that never influence pipeline.
Relevant KPIs may include:
- Qualified lead rate.
- Meeting or demo booking rate.
- Opportunity creation rate.
- Chatbot-assisted conversion rate.
- Pipeline or revenue influenced.
- Cost per qualified lead.
Supporting metrics include engagement rate, form completion, response time, drop-off by question, source channel, lead score distribution, and human sales acceptance rate.
Attribution is the hardest part. A prospect may talk to the bot, read a case study, return through paid search, and book a meeting two weeks later. Decide whether the chatbot receives first-touch, last-touch, linear, or assisted attribution before publishing revenue claims. Use the same model consistently across periods.
E-commerce Chatbots
An e-commerce chatbot may combine product discovery, customer support, order management, and cart recovery. This creates several possible outcomes within the same interface.
Useful KPIs include:
- Product discovery completion rate.
- Add-to-cart rate after a chatbot recommendation.
- Purchase conversion rate for chatbot-assisted sessions.
- Recovered cart value.
- Average order value influenced.
- Support deflection for order and policy questions.
The team should segment results by the user’s original intent. A shopper asking about return conditions should not be evaluated against the same conversion target as a shopper requesting a product recommendation. Otherwise, a rise in support traffic can make sales performance appear weaker even when the recommendation flow has improved.
Recommendation quality also needs a guardrail. An increase in conversion is not healthy if return rates, cancellations, negative feedback, or customer complaints rise afterward.
Internal HR and IT Chatbots
Internal chatbots are usually designed to help employees complete routine tasks, find approved information, and avoid unnecessary service desk tickets.
Typical ones include:
- Self-service completion rate.
- Avoided HR or IT tickets.
- Time to resolution.
- Employee adoption among the eligible population.
- Repeat request rate.
- Cost or staff time saved per completed workflow.
Supporting metrics may include authentication success, knowledge freshness, search and retrieval quality, escalation reason, department, location, language, and task type.
For an internal bot, repeat usage can be positive or negative. Employees may return because the chatbot is useful, or because the same issue was not resolved. Separate recurring legitimate tasks, such as checking leave balances, from repeated attempts to solve the same problem.
The Four-Layer Chatbot KPI Framework
A practical chatbot analytics model can be organized into four layers. Each layer answers a different question and contains both leading and lagging indicators.
A chatbot with weak adoption cannot create large business impact, even if its answer quality is high. A chatbot with excellent engagement but poor resolution may increase customer effort. A chatbot with strong containment but rising repeat contacts may be closing sessions without solving issues. A chatbot with good operational performance may still have negative ROI if licensing, model inference, maintenance, and integration costs are too high.
The framework also helps teams separate leading from lagging indicators. Intent coverage, fallback rate, retrieval quality, and latency often reveal deterioration before CSAT, conversion, or cost per resolution move. Business KPIs confirm value, while diagnostic metrics provide earlier signals and point to corrective action.
The following sections explain how to calculate and interpret the metrics in each layer. The formulas are starting points, not universal accounting standards. Define eligible populations, time windows, resolution rules, and exclusions in a shared measurement dictionary before comparing results.
Engagement and Adoption Metrics
Engagement metrics show whether users encounter the chatbot, decide to start a conversation, and continue far enough to receive value. They are essential for diagnosing reach and usability, but they should not be treated as proof of resolution.
Conversation Volume
What it measures. Conversation volume is the number of chatbot conversations initiated or active during a defined period. It can be reported as total conversations, unique users, messages, or eligible conversations.
Formula: Conversation volume = Count of unique conversation IDs during the period
Define when a new conversation begins. A 30-minute inactivity window, a new authenticated task, or a new support case can produce different counts. Also separate test traffic, internal QA, spam, monitoring requests, and retries caused by technical errors.
How to interpret it. Volume provides context for every other chatbot metric. A fallback rate based on 50 conversations is less stable than the same rate based on 50,000. Changes in volume can reveal seasonality, campaign effects, outages in another channel, a new widget placement, or growing user adoption.
Volume alone does not indicate success. An increase can result from greater demand, duplicate requests, poor website navigation, or unresolved issues that push customers back into the bot.
What can distort it. Session timeout rules, cross-device users, anonymous identity, bot traffic, repeated page reloads, proactive greetings, channel migrations, and internal testing can all inflate or fragment the count.
What to do if it changes. Segment the change by channel, page, intent, customer type, geography, language, and new versus returning users. Then compare volume with resolution, abandonment, repeat contact, and conversion. The combination shows whether the chatbot attracted useful demand or simply absorbed more activity.
Engagement Rate
What it measures. Engagement rate estimates the share of eligible users who actively interact with the chatbot rather than merely seeing the widget or invitation.
Formula: Engagement rate = Engaged eligible users / Eligible users exposed to the chatbot × 100
“Engaged” may mean sending the first message, clicking a suggested action, opening the widget, or completing the first meaningful step. Sending a message is usually the cleanest threshold because an accidental widget open is weak evidence of intent.
How to interpret it. A low rate may indicate poor discoverability, low trust, irrelevant placement, confusing copy, or limited demand for conversational help. A high rate can be positive, but it can also indicate that users cannot complete tasks through the main interface.
Compare engagement by page and user intent. A pricing page, support center, checkout, and employee portal have very different natural interaction rates.
What can distort it. Proactive pop-ups, auto-open behavior, mobile layout problems, cookie restrictions, duplicate visitors, campaign traffic, and changes in the denominator can make the rate move without any change in bot quality.
What to do if it changes. Review exposure and activation events first. Then test placement, invitation text, suggested prompts, and timing. Do not optimize for widget opens. Optimize for qualified conversations that proceed to a meaningful outcome.
Return User Rate
What it measures. Return user rate shows the share of identified users who have more than one chatbot session within a defined period.
Formula: Return user rate = Users with two or more sessions / Unique chatbot users × 100
How to interpret it. For HR, IT, banking, subscription, and account-service bots, return usage can demonstrate adoption because users have recurring needs. For a one-time lead-generation flow, a high return rate may signal indecision or incomplete answers.
The metric becomes more useful when users are classified by reason for returning: a new task, a follow-up, or the same unresolved issue. A simple user-level count cannot distinguish loyalty from repeated failure.
What can distort it. Cookie deletion, shared devices, anonymous users, cross-channel conversations, changed login states, and identity resolution errors can undercount or overcount returning users.
What to do if it changes. Combine return rate with repeat intent, resolution status, and time between sessions. If users return for different successful tasks, invest in broader self-service. If they return quickly with the same intent, inspect answer quality, task completion, and reopen rules.
Abandonment and Drop-Off Rate
What it measures. Abandonment rate is the share of initiated conversations that end before a defined meaningful outcome, explicit exit, or human handoff. Drop-off analysis identifies the exact step where users leave.
Formula: Abandonment rate = Abandoned conversations / Initiated conversations × 100
The difficult part is defining abandonment. A user who receives a correct one-message answer and closes the chat may be successfully resolved. A user who disappears after a failed identity check is more likely to have abandoned the process. Use outcome and conversation stage, not inactivity alone.
How to interpret it. High early drop-off can indicate an intrusive invitation, unclear first message, slow response, or mismatch between user expectations and bot capabilities. Later drop-off often points to long forms, repeated questions, authentication friction, poor answer quality, or a missing human option.
What can distort it. Short informational conversations, backgrounded mobile apps, browser closures, delayed responses, channel switching, and session timeout rules can make successful interactions look abandoned.
What to do if it changes. Build a funnel by conversation step and intent. Review transcripts around the largest drop-off points. Pair abandonment with latency, fallback, escalation availability, and task completion. Never celebrate a lower escalation rate when abandonment is rising at the same time.
Understanding and Customer Experience Metrics
This layer evaluates whether the chatbot recognizes what users need, retrieves or generates an acceptable response, and provides a usable interaction. These metrics are especially important because they often move before business outcomes deteriorate.
Intent Recognition Accuracy and Intent Coverage
What it measures. Intent recognition accuracy shows how often a classifier assigns the correct intent to a user message. Intent coverage measures how much relevant demand the bot is designed and equipped to handle.
Formulas: Intent recognition accuracy = Correctly classified labeled messages / All labeled messages × 100; Intent coverage = Eligible demand categories with an acceptable bot path / All eligible demand categories × 100
Accuracy requires a labeled evaluation set. Production confidence scores are not accuracy; a model can be confidently wrong. Coverage also needs a denominator. It can be based on the top intents, the percentage of historical tickets represented, or a business-approved catalog of eligible tasks.
How to interpret it. Low accuracy means known intents are being confused. Low coverage means users are asking about needs the bot was not designed to address. The remediation is different: improve training and classification for accuracy, but add knowledge, tools, or flows for coverage.
What can distort it. Class imbalance, outdated labels, overlapping intents, multilingual traffic, compound requests, synthetic test data, and an evaluation set that does not reflect production demand can produce misleading scores.
What to do if it changes. Review confusion matrices and accuracy by intent cluster, language, channel, and message type. Create a recurring human-labeled sample from production. For generative systems without explicit intents, use task or topic classification for analytics even if routing is performed by an LLM.
Fallback and Non-Response Rate
What it measures. Fallback rate shows how often the chatbot cannot confidently understand, retrieve, generate, or safely deliver a response. Non-response rate captures technical cases where no usable answer reaches the user.
Formulas: Fallback rate = Conversations or turns with a fallback / Eligible conversations or turns × 100; Non-response rate = User messages without a delivered usable response / User messages requiring a response × 100
Track fallbacks by reason: no intent match, no relevant knowledge, low retrieval confidence, policy refusal, unavailable tool, malformed output, timeout, or internal error. Combining them into one number hides the required fix.
How to interpret it. A rise usually points to a change in traffic mix, missing knowledge, a regression in prompts or models, broken integrations, or an overly strict confidence threshold. A very low fallback rate is not automatically good if the system answers unsupported questions instead of admitting uncertainty.
What can distort it. Changed thresholds, new languages, seasonal topics, retries, user typos, model version changes, and different counting at turn versus conversation level can shift the metric.
What to do if it changes. Inspect the fallback reason distribution and the highest-volume affected intents. Add knowledge or tools where appropriate, improve clarification prompts, and maintain a safe refusal or escalation path. For generative AI, monitor groundedness alongside fallback rate so that reducing fallbacks does not increase hallucinations.
First Response Time and End-to-End Latency
What it measures. First response time is the delay between the user’s first message and the chatbot’s first visible response. End-to-end latency measures the time until the complete answer or action result is delivered.
Formulas: First response time = Timestamp of first visible bot response − Timestamp of user message; End-to-end latency = Timestamp of final usable result − Timestamp of user message
For streaming systems, also track time to first token, time to final token, retrieval latency, tool latency, and handoff wait time. Report percentiles such as p50, p95, and p99 rather than only an average. Averages can hide a small but important group of very slow conversations.
How to interpret it. Speed influences perceived quality, but the fastest answer is not always the best answer. A short acknowledgement can improve perceived responsiveness while retrieval or tool execution continues. Longer latency may be acceptable for a complex account action if progress is clearly communicated.
What can distort it. Network conditions, geography, channel APIs, client rendering, streaming behavior, retries, long generated answers, tool dependencies, and timeouts can affect different parts of the latency chain.
What to do if it changes. Trace latency by component and model version. Reduce unnecessary calls, parallelize independent steps, cache reusable context, shorten outputs, and use deterministic logic for tasks that do not need an LLM. OpenAI’s latency guidance similarly treats response speed as a system problem rather than only a model-speed problem.
CSAT, Sentiment, and Chatbot-Specific NPS
What it measures. Customer Satisfaction Score (CSAT) captures direct user feedback about an interaction. Sentiment estimates emotional tone from conversation content. Chatbot-specific Net Promoter Score (NPS) asks whether users would recommend the experience or service after interacting with the bot.
Formulas: CSAT = Positive survey responses / All valid survey responses × 100; NPS = Percentage of promoters − Percentage of detractors
Sentiment usually comes from a classifier and should be treated as a model output with its own validation error, not as objective truth.
How to interpret it. CSAT is useful when segmented by intent, resolution status, bot-only versus human-assisted outcome, and survey design. A global score can hide one highly damaging flow. NPS is broader and less diagnostic; it may reflect the product, company, or original problem more than the chatbot itself.
What can distort it. Low survey response rates, selection bias, different rating scales, survey placement, repeated prompts, cultural differences, user frustration with the underlying issue, and mixing bot and agent results can all affect scores.
What to do if it changes. Check survey participation and traffic mix before concluding that experience changed. Review low-scoring transcripts by intent and outcome. Use sentiment to prioritize review, not to replace direct feedback or human quality assurance. Keep chatbot-only and human-assisted CSAT separate.
 Services Account
Resolution and Efficiency Metrics
Resolution metrics determine whether the chatbot completed the user’s actual task, not merely whether it produced a response or prevented an immediate handoff.
Containment Rate vs Deflection Rate
What they measure. Chatbot containment rate measures the share of chatbot conversations that stay within the automated channel without a live agent joining. Chatbot deflection rate estimates how many human-support contacts were avoided because self-service was available.
Formulas: Containment rate = Contained chatbot conversations / Eligible chatbot conversations × 100; Deflection rate = Avoided human contacts attributable to self-service / Expected human contacts without self-service × 100
Containment has an observed chatbot denominator. Deflection depends on a counterfactual: how many tickets, calls, or chats would have occurred without the bot. This normally requires a pre-launch baseline, a control group, matched time periods, or another attribution method.
How to interpret them. Containment describes channel behavior. Deflection describes operational impact. Neither proves resolution unless outcome rules are added. As Zendesk notes in its discussion of deflection versus resolution, keeping a request out of the queue creates value only when the user actually finds the answer or completes the task.
What can distort them. Forced bot entry, hidden human options, user abandonment, seasonality, changes in support demand, altered staffing, duplicate contacts, new products, and inconsistent eligibility rules can inflate either rate.
What to do if they change. Pair containment with FCR, CSAT, abandonment, and repeat contact. Validate deflection against historical volume and demand drivers. Rename the KPI “verified containment” when it requires both no human takeover and a positive resolution signal.
First Contact Resolution
What it measures. First Contact Resolution (FCR) is the share of issues resolved during the initial conversation without the user returning through another session or channel for the same problem.
Formula: FCR = Issues resolved on first contact / All eligible issues initiated × 100
A strong definition needs an identity strategy, an issue or intent key, and a repeat-contact window. Depending on the use case, the window may be 24 hours, 7 days, or the duration of a case lifecycle.
How to interpret it. FCR is a stronger quality indicator than containment because it looks for an outcome and the absence of immediate rework. Track it by intent and complexity. A password reset and a disputed insurance claim should not share the same target.
What can distort it. Anonymous users, channel switching, imperfect intent matching, unresolved users who never return, long-running cases, survey-based self-reporting, and inconsistent resolution labels can bias the result.
What to do if it changes. Compare FCR with containment and reopen rate. If containment rises while FCR falls, the bot may be ending conversations too early. Review failure paths, knowledge accuracy, tool results, and handoff quality for the affected intent groups.
Escalation and Human Takeover Rate
What it measures. Escalation rate is the share of conversations transferred or referred to a human. It can be separated into user-requested, bot-triggered, policy-required, confidence-based, and technical escalations.
Formula: Escalation rate = Escalated eligible conversations / Eligible chatbot conversations × 100
How to interpret it. Escalation is a safety and service mechanism, not simply lost automation. A healthy chatbot resolves suitable requests and escalates cases that require empathy, authority, judgment, sensitive data handling, or exception management.
A rising rate may show poorer performance, but it can also result from expansion into more complex intents. A very low rate can be dangerous when abandonment, complaints, or unsupported answers are increasing.
What can distort it. Agent availability, office hours, placement of the “talk to a person” option, policy changes, proactive transfers, user type, and conversation mix all influence the number.
What to do if it changes. Break escalations down by reason, intent, conversation stage, and outcome after handoff. Measure whether context, authentication state, and transcript history were transferred successfully. Optimize for appropriate escalation and successful takeover, not the lowest possible rate.
Average Handling Time and Conversation Length
What they measure. Average Handling Time (AHT) measures the time from conversation start to resolution or handoff. Conversation length may be expressed as elapsed time, number of turns, user messages, or bot messages.
Formulas: AHT = Total handling time for eligible conversations / Number of eligible conversations; Average turns = Total conversation turns / Number of conversations
How to interpret them. Lower is not always better. A complex task may require several clarification steps. An extremely short conversation can be a successful answer, an immediate fallback, or abandonment. Compare handling time for the same intent, outcome, and channel.
For ROI, the most useful comparison is often bot handling time versus the human baseline for the same task. For experience, evaluate effort together with CSAT and completion.
What can distort them. Idle time, asynchronous messaging, user interruptions, long generated responses, authentication waits, tool processing, agent queue time, and session timeouts can dominate the measure.
What to do if they change. Use stage-level timing and conversation-path analysis. Remove redundant questions, prefill known information, improve entity extraction, communicate progress during long actions, and shorten generated responses where verbosity does not add value. Do not reduce necessary verification or safety steps merely to improve AHT.
Ticket Reopen and Repeat Contact Rate
What they measure. Ticket reopen rate measures how often a case labeled resolved becomes active again. Repeat contact rate measures users who return with the same issue within a defined window, including through another channel.
Formulas: Ticket reopen rate = Reopened bot-associated cases / Bot-associated cases marked resolved × 100; Repeat contact rate = Users or issues returning with the same problem / Issues initially marked resolved × 100
How to interpret them. These are essential checks on optimistic resolution labels. A chatbot may appear efficient when it ends sessions quickly, but repeat contact reveals whether the underlying need persisted.
A rise can indicate incomplete instructions, inaccurate answers, a failed backend action, unclear next steps, or premature closure. It may also reflect legitimate follow-up in a multi-stage process.
What can distort them. Weak identity matching, broad intent categories, channel fragmentation, legitimate recurring tasks, long resolution cycles, and customer behavior outside the tracked ecosystem can change the rate.
What to do if they change. Review reopened conversations and the original resolution evidence. Tighten closure rules, verify transactional outcomes, improve post-action confirmation, and add follow-up checks for high-risk workflows. Segment legitimate follow-ups from repeated failure.
 Services Account
Business Impact Metrics
Business impact metrics connect chatbot behavior to outcomes that matter to leadership: revenue, qualified demand, cost, productivity, risk, or return on investment.
Conversion and Qualified Lead Rate
What they measure. Conversion rate is the share of eligible chatbot users who complete a target action. Qualified lead rate measures leads that meet agreed criteria rather than all captured contacts.
Formulas: Chatbot conversion rate = Attributed conversions / Eligible chatbot conversations or users × 100; Qualified lead rate = Sales-accepted or criteria-qualified chatbot leads / Chatbot leads captured × 100
Possible conversions include purchases, demo bookings, registrations, quote requests, completed applications, or product activations.
How to interpret them. Define whether the metric measures direct conversion in the conversation or assisted conversion within an attribution window. Compare against an appropriate control, such as similar visitors without chatbot engagement, but account for selection bias: users who choose to chat may already have stronger intent.
What can distort them. Attribution model, campaign mix, page placement, seasonality, duplicate leads, bot incentives, sales acceptance rules, and changes in the offer can move conversion independently of chatbot quality.
What to do if they change. Segment the funnel by source, intent, product, conversation path, and qualification outcome. Review drop-off at each question. Optimize for downstream opportunity quality and revenue, not just form completion.
Cost per Resolved Conversation
What it measures. Cost per resolved conversation estimates the fully loaded chatbot operating cost required to produce a verified resolution.
Formula: Cost per resolved conversation = Total attributable chatbot cost / Verified bot resolutions
The numerator may include platform licenses, model inference, retrieval and vector storage, cloud infrastructure, monitoring, support, human review, knowledge maintenance, integration maintenance, and allocated product or engineering labor.
How to interpret it. Compare the result with the cost of resolving equivalent requests through human channels, not with the average cost of all tickets. Simple and complex cases have different baselines. Also examine marginal cost as volume grows, because fixed costs and inference costs behave differently.
A low cost is meaningful only when FCR, CSAT, safety, and repeat contact remain acceptable.
What can distort it. Excluding internal labor, counting all contained sessions as resolved, mixing pilot and production periods, ignoring repeat contacts, and comparing different issue types can create an unrealistically favorable number.
What to do if it changes. Decompose cost by platform, model, token usage, tool calls, infrastructure, and human operations. Then inspect resolution volume and quality. Use smaller models, caching, deterministic flows, better retrieval, or shorter outputs where they preserve performance.
How to Calculate Chatbot ROI
What it measures. This is a critical chatbot metric. It compares the financial value attributable to the chatbot with the total cost of building and operating it.
Formula: Chatbot ROI = (Total attributable benefit − Total chatbot cost) / Total chatbot cost × 100
Potential benefits include avoided support cost, employee time saved, incremental gross profit, increased conversion, reduced handling time for human agents, lower error cost, and faster completion of internal processes.
A support savings model can be expressed as:
Avoided support value = Verified deflected contacts × Avoided variable cost per comparable human contact
A sales value model can use incremental contribution margin rather than top-line revenue:
Incremental sales value = Attributed incremental orders × Contribution margin per order
How to interpret it. ROI should be calculated for a defined period and compared with the counterfactual scenario. Separate one-time implementation cost from recurring operating cost. Report assumptions and provide a conservative, expected, and upside scenario when attribution is uncertain.
What can distort it. Treating all chatbot conversations as avoided tickets, using total revenue instead of incremental margin, ignoring repeat contacts, excluding maintenance, and claiming value from outcomes that would have happened anyway can significantly overstate ROI.
What to do if it changes. Identify whether the movement comes from adoption, resolution, unit economics, traffic mix, or attribution. Do not optimize the financial model before fixing the underlying measurement. A credible ROI calculation should reconcile with CRM, help desk, finance, and product analytics data.
Advanced Chatbot Performance Metrics for Generative AI and RAG Chatbots
Traditional chatbot analytics are not enough for systems that generate free-form answers, retrieve documents, call tools, or make multi-step decisions. These systems need an evaluation layer that measures factual support, retrieval quality, model behavior, cost, and risk.
The RAGAS research framework illustrates why RAG evaluation must consider both retrieval and generation. A fluent final answer can still be based on irrelevant context, while excellent retrieved context can be used incorrectly by the model.
Grounded Answer Rate and Hallucination Rate
What they measure. Grounded answer rate is the share of evaluated answers whose material claims are supported by approved sources or verified tool results. Hallucination rate is the share containing unsupported, contradicted, or fabricated material claims.
Formulas: Grounded answer rate = Answers passing the grounding rubric / Evaluated answers × 100; Hallucination rate = Answers with at least one material unsupported claim / Evaluated answers × 100
Claim-level scoring is often more informative than answer-level scoring because one answer may contain several supported facts and one critical unsupported statement.
How to interpret them. Define materiality based on risk. A wrong product color and a fabricated refund policy should not have equal severity. Track results by intent, source collection, model, prompt version, language, and answer type.
What can distort them. Weak evaluation rubrics, incomplete source documents, unreliable LLM judges, outdated gold answers, and sampling only easy conversations can produce false confidence. OpenAI’s evaluation guidance recommends validating automated graders against human labels and using clear pass/fail criteria.
What to do if they change. Inspect retrieval context, citation mapping, prompt instructions, source freshness, and model changes. Add abstention and escalation behavior for insufficient evidence. Use human review for high-risk samples and periodically recalibrate automated evaluators.
 Services Account
Retrieval Quality
What it measures. Retrieval quality evaluates whether the system finds the information needed to answer a query and ranks the most useful context highly enough to reach the generator.
Common metrics include hit rate at k, precision at k, recall at k, Mean Reciprocal Rank (MRR), context precision, and context recall.
Example formulas: Recall@k = Relevant items retrieved in the top k / All relevant items for the query; Precision@k = Relevant items retrieved in the top k / k; MRR = Average of 1 / rank of the first relevant result
How to interpret it. Low recall means necessary information is missing from the retrieved context. Low precision means too much irrelevant content competes for the model’s attention. Good retrieval should be measured against a curated test set of representative queries and relevant documents.
What can distort it. Incomplete relevance labels, duplicate chunks, outdated documents, chunking strategy, metadata filters, multilingual queries, access permissions, and dynamic content all influence results.
What to do if it changes. Analyze failures by source, intent, query style, and document type. Improve content structure, chunking, metadata, hybrid search, reranking, query rewriting, and knowledge freshness. Evaluate retrieval separately from final-answer quality so that generator improvements do not hide retrieval regressions.
AI Latency and Cost per Answer
What they measure. AI latency captures the time spent in model inference, retrieval, tool calls, moderation, and orchestration. Cost per answer estimates variable and allocated costs associated with producing a delivered response.
Formulas: Cost per answer = Total model, retrieval, tool, and infrastructure cost / Delivered eligible answers; Cost per successful answer = Total attributable AI cost / Answers passing the defined success rubric
Track input tokens, output tokens, cached tokens, model calls, retry rate, retrieval operations, tool calls, and p50/p95/p99 latency. Cost per successful answer is more useful than cost per generated answer because cheap failures do not create value.
How to interpret it. Larger models may improve difficult answers but increase latency and cost. Smaller models, deterministic flows, or cached responses may be better for simple tasks. The correct objective is efficient quality, not the lowest token bill.
What can distort it. Free credits, changing provider prices, retries, background evaluations, shared infrastructure, long conversations, hidden tool costs, and excluding failed calls can skew the metric.
What to do if it changes. Route tasks by complexity, shorten unnecessary output, optimize retrieved context, cache stable content, parallelize independent calls, reduce retries, and monitor model-version changes. Keep quality and safety guardrails in the same optimization report.
Safety, Privacy, and Compliance Metrics
What they measure. These metrics evaluate whether the chatbot follows approved policies, protects sensitive information, resists misuse, keeps appropriate records, and escalates high-risk situations.
Possible measures include:
- Policy violation rate.
- Sensitive data exposure rate.
- Prompt injection attack success rate.
- Unsafe or unauthorized tool action rate.
- Correct refusal and escalation rate.
- Access-control failure rate.
- Audit log completeness.
- Consent, retention, and deletion compliance.
- Human review coverage for high-risk outcomes.
Example formula.
Sensitive data exposure rate = Responses exposing prohibited data / Evaluated responses × 100
How to interpret them. Use risk severity, not only frequency. One disclosure of regulated personal data may matter more than hundreds of low-severity formatting errors. Define the threat model and expected behavior by use case.
What can distort them. Testing only normal user prompts, missing adversarial cases, weak red-team datasets, incomplete logging, and treating a model refusal as safe without checking downstream tool actions can hide risk.
What to do if they change. Pause or restrict affected capabilities, investigate traces, update access controls and guardrails, retest adversarial scenarios, and document corrective action. The NIST AI Risk Management Framework encourages lifecycle-based measurement and management of generative AI risks, while the OWASP guidance for LLM applications highlights risks such as sensitive information disclosure, insecure integrations, excessive agency, and overreliance.
These metrics support governance and engineering decisions but do not replace legal, security, or compliance review.
How to Set Meaningful Chatbot Benchmarks
A benchmark is useful only when its definition, population, and context match your chatbot. Public numbers are often based on vendor-selected customers, different definitions of containment, different issue complexity, and different channels. Treat them as directional references, not universal pass/fail standards.
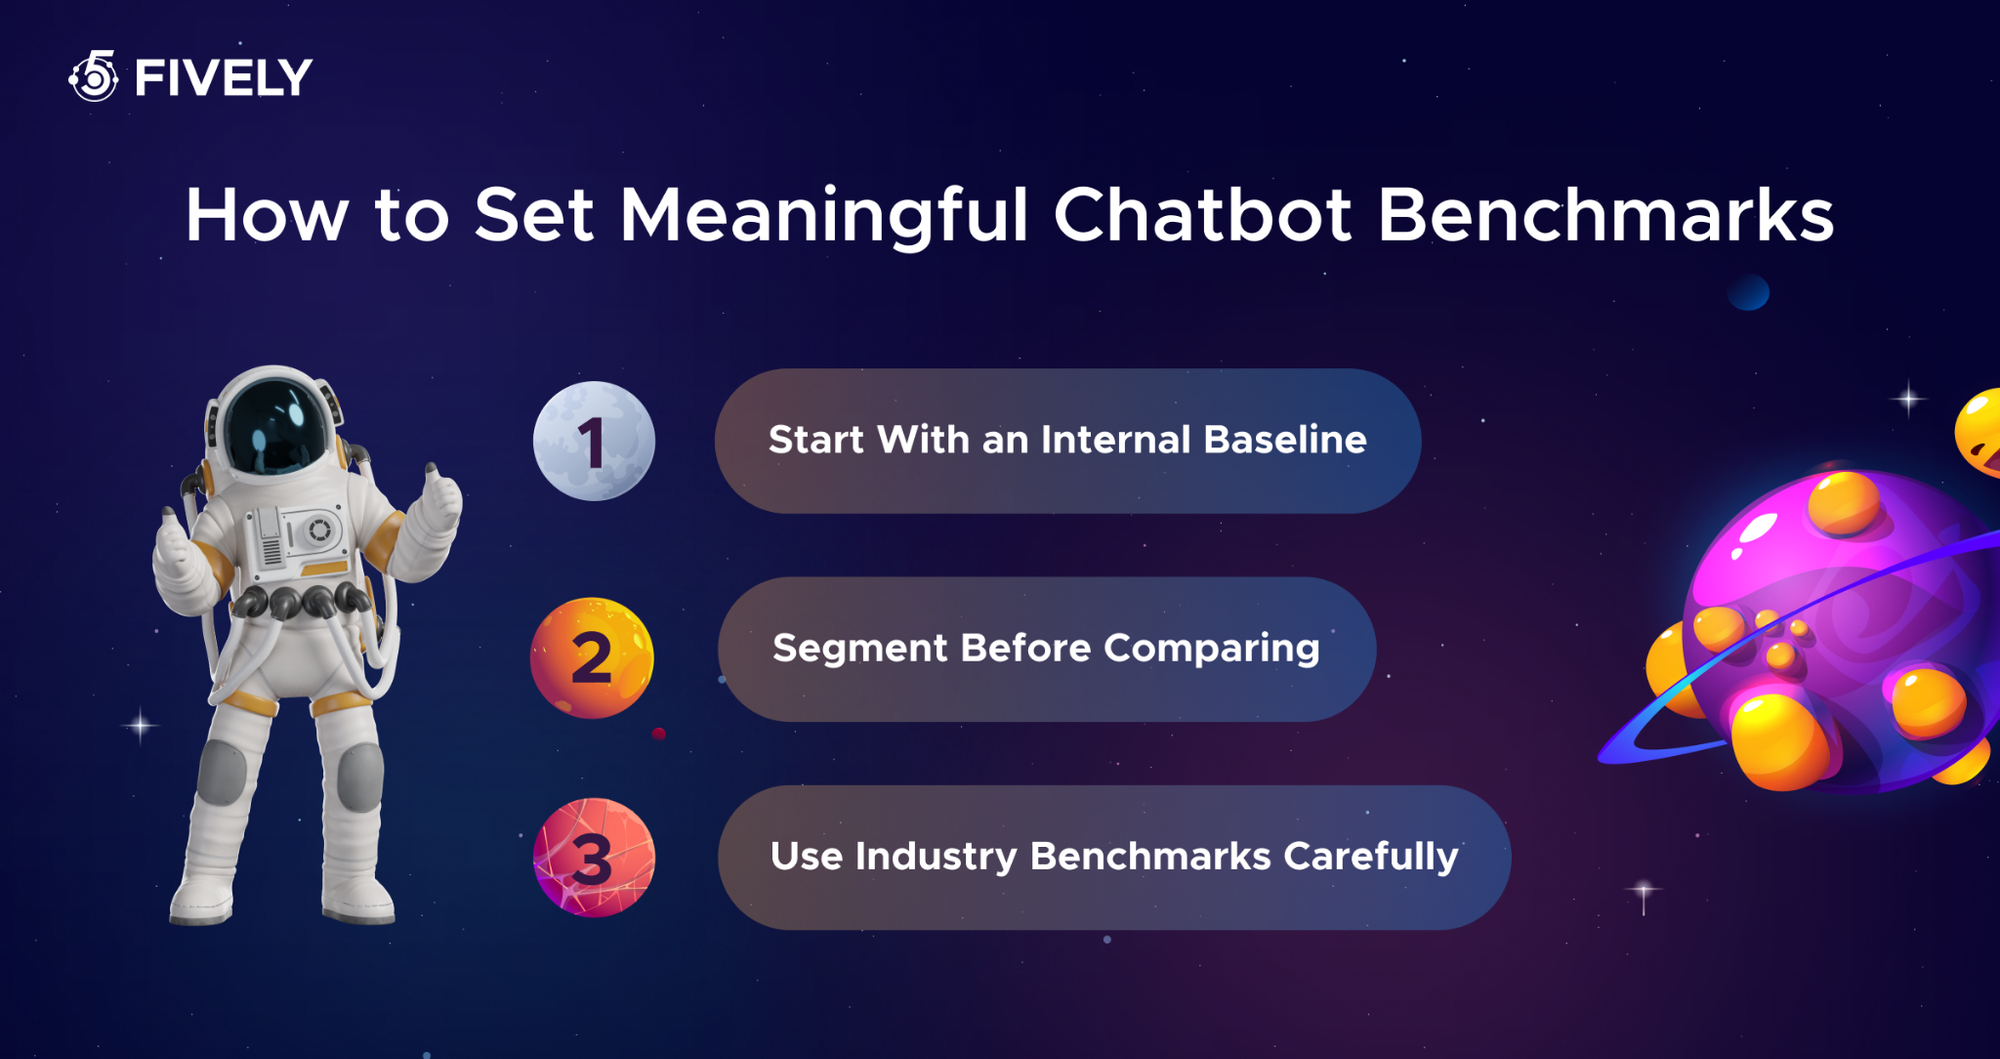
Start With an Internal Baseline
Measure the relevant business process before launch. For support, collect historical ticket and contact volume, cost, handling time, FCR, reopen rate, and CSAT for at least one representative period. For sales, capture current conversion, lead quality, booking rate, and cycle time. For internal service, measure ticket demand and employee time.
The baseline should cover seasonality where possible. A 30-day period may be enough for a stable high-volume operation, while a quarterly or annual cycle may be necessary for seasonal demand.
After launch, compare equivalent populations. If the bot handles only common questions, do not compare its outcomes with the full human queue, which includes complex cases.
Use three values for each KPI:
- Guardrail: the minimum acceptable quality, safety, or customer experience level.
- Target: the expected result for the current improvement period.
- Stretch target: a higher result that may require expanded knowledge, tools, or process change.
Segment Before Comparing
An aggregate chatbot performance number can hide both excellent and dangerous behavior. Segment at least by:
- Use case and intent.
- Bot-only, escalated, and human-assisted outcome.
- New versus returning user.
- Channel and device.
- Language and geography.
- Customer or employee group.
- Model, prompt, workflow, and knowledge-base version.
- Low-, medium-, and high-complexity tasks.
A chatbot may have strong FCR for order status and weak FCR for returns. The combined average is not actionable. Similarly, a high fallback rate may come almost entirely from one new product line or one language.
Segmentation must be designed into the event model. It is difficult to reconstruct later if conversations were not tagged with intent, version, channel, outcome, and relevant business identifiers.
Use Industry Benchmarks Carefully
External benchmarks can help validate whether a target is plausible, but they should not override the internal baseline. Different industries have different eligibility and risk thresholds. Healthcare, legal, insurance, and financial chatbots may appropriately escalate more conversations than retail product-discovery bots.
Before using an external figure, ask:
- Does it use the same formula and denominator?
- Does it measure containment, deflection, or verified resolution?
- Is it based on rule-based, NLU, RAG, or agentic AI systems?
- Does it cover the same channel and task complexity?
- Is it a median, top-quartile result, vendor claim, or audited study?
- Are quality and repeat-contact guardrails included?
A reasonable first target is often an improvement over your own baseline for a defined eligible scope, not an attempt to match a headline number from another organization.
How to Instrument Chatbot Metrics
Reliable chatbot analytics require more than exporting conversation transcripts. You need events that connect user behavior, bot decisions, model and retrieval operations, business-system outcomes, and subsequent contacts.
Google’s Dialogflow CX analytics, for example, distinguishes outcomes such as abandonment and live-agent handoff and supports analysis by conversation path. For custom systems, a vendor-neutral observability framework such as OpenTelemetry can help correlate traces, metrics, and logs across the chatbot, model, retrieval layer, and backend services.
Define a Shared Event Model
Create an analytics dictionary before implementation. Every event should have an owner, trigger, timestamp, required properties, privacy classification, and retention rule.
A practical event model may include:
Avoid putting raw sensitive conversation content into every analytics event. Use pseudonymous identifiers, controlled text storage, access limits, and defined retention. Store the minimum data required for the metric and investigation.
Connect the Chatbot to Business Systems
Chatbot logs can show messages and handoffs, but they cannot independently prove revenue, ticket avoidance, completed refunds, employee task completion, or repeat contact.
Connect analytics to the systems that hold the outcome:
- CRM for leads, opportunities, and revenue attribution.
- Help desk for tickets, reopen events, agent handling, and resolution.
- E-commerce platform for carts, orders, returns, and margin.
- Identity provider for eligible user populations and secure task completion.
- HRIS or ITSM for employee workflows and avoided service requests.
- Data warehouse or BI layer for cross-channel analysis.
- Model and observability platform for prompts, retrieval, traces, latency, and cost.
Use stable identifiers to join records, but apply privacy-by-design controls. Not every analyst needs access to full transcripts or personal data.
Establish Resolution and Attribution Rules
The word “resolved” must have a documented hierarchy of evidence. Possible signals include:
- A backend transaction completed successfully.
- The user explicitly confirmed that the issue was solved.
- The bot reached an approved terminal state and no repeat contact occurred within the defined window.
- A human reviewer or agent marked the outcome resolved.
- A survey response indicated resolution.
These signals have different reliability. A transaction result is stronger than session closure. Store the method used so that teams can compare strict and broad resolution rates.
Attribution rules need the same discipline. Define the eligible conversion, lookback window, identity matching, deduplication, and credit model. Keep chatbot-assisted revenue separate from directly completed chatbot revenue.
Version the measurement definitions. If the resolution rule changes, annotate the dashboard so that an apparent performance jump is not mistaken for a product improvement.
What a Useful Chatbot KPI Dashboard Should Show
One dashboard cannot serve every audience equally. Operations teams need rapid diagnostic signals:
A useful dashboard should also provide:
- Filters for intent, channel, language, user segment, outcome, and version.
- Trends rather than isolated snapshots.
- Targets and guardrails with clear definitions.
- Confidence intervals or sample sizes for survey and evaluation metrics.
- Drill-down from KPI to conversation path and root-cause metrics.
- Release annotations for model, prompt, knowledge, UX, and policy changes.
- Separate bot-only and human-assisted outcomes.
Do not place every available number on the executive page. The executive view should answer four questions: Are people using the chatbot? Is it resolving the intended tasks? Is quality acceptable? Is the result worth the cost and risk?
Common Chatbot KPI Mistakes
Using Conversation Volume as Proof of Success
Volume measures activity. It does not prove resolution, satisfaction, revenue, or savings. Always connect it to an outcome rate and an eligible population.
Treating Every Contained Conversation as Resolved
A contained conversation may have ended through success, abandonment, frustration, or a missing handoff option. Require resolution evidence and monitor repeat contact.
Celebrating an Extremely Low Escalation Rate
Low escalation can mean strong automation, but it can also mean that users cannot reach a person. Review escalation with abandonment, CSAT, complaints, and safety outcomes.
Mixing Chatbot and Agent CSAT
Bot-only and human-assisted conversations have different complexity and service dynamics. Combining them produces a score that does not accurately describe either experience.
Calculating Deflection Without a Baseline
Deflection estimates contacts avoided compared with what would otherwise have happened. Without historical data, a control group, or a forecasting method, the number is only an assumption.
Tracking Only Averages
Average latency, handling time, CSAT, or FCR can hide serious problems in one intent, language, channel, or percentile. Use segments and distribution metrics such as p95 latency.
Ignoring Survey Response Bias
Users who answer a survey are not always representative. Track response rate, survey placement, and outcome mix. Combine feedback with behavioral and resolution evidence.
Changing Multiple Components Simultaneously
A model, prompt, knowledge base, UI, and routing update released together may improve the KPI, but the team will not know why. Use versioning, controlled experiments, and staged rollouts where possible.
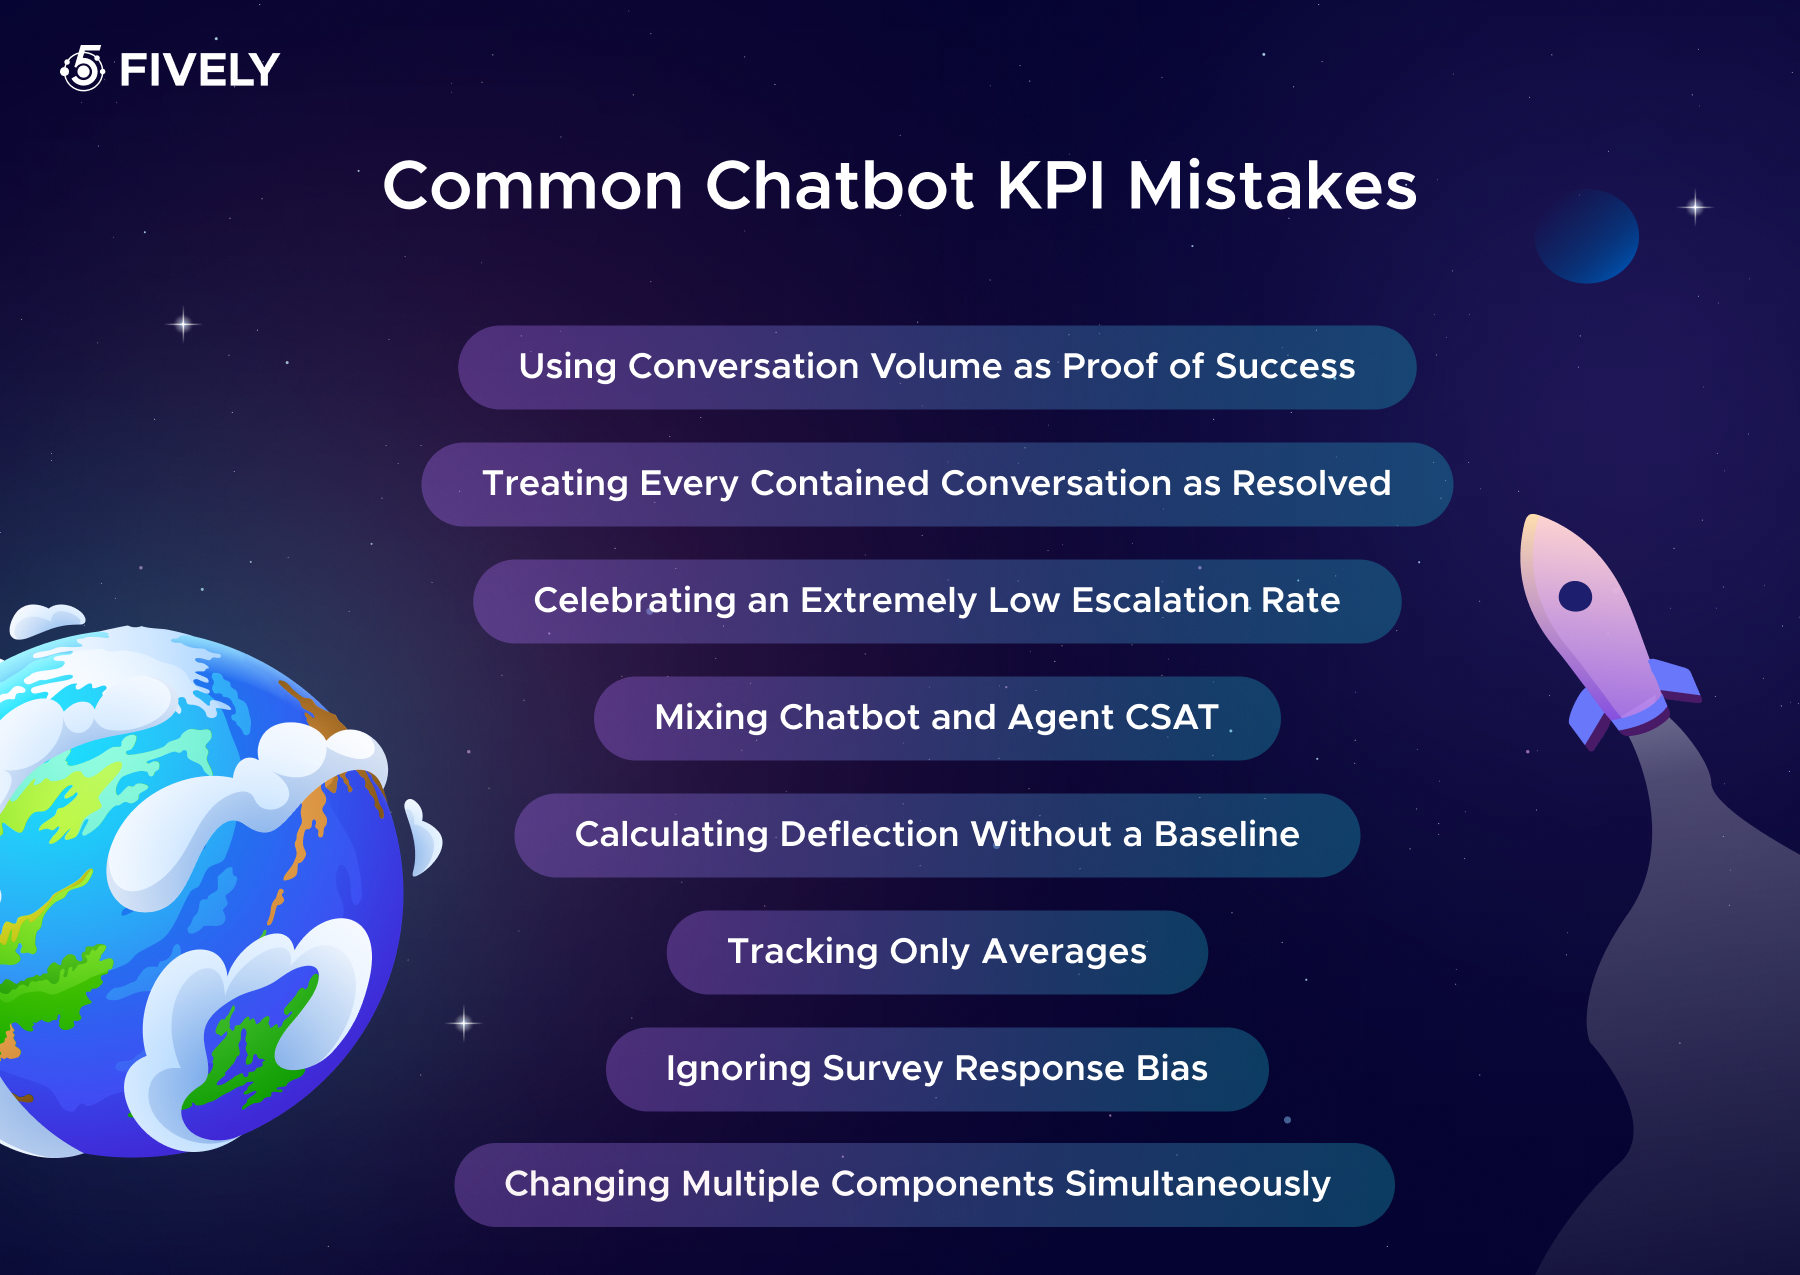
The broader pattern is simple: every optimistic KPI needs a quality check. Containment needs FCR and abandonment. Conversion needs lead quality and downstream revenue. Low cost needs repeat-contact and satisfaction guardrails. Fast answers need accuracy and groundedness.
Turn Chatbot Analytics Into Business Decisions With Fively
A chatbot measurement system should be designed alongside the chatbot itself. Adding analytics after launch often leaves teams with message counts, generic satisfaction scores, and incomplete handoff data, while the business outcomes remain in separate CRM, help desk, e-commerce, or internal systems.
Fively helps companies design and build custom AI chatbots, RAG assistants, and automated workflows with measurement built into the architecture. This can include KPI definition, event schemas, conversation and model observability, CRM or ticketing integrations, evaluation datasets, RAG quality testing, safety controls, and role-specific dashboards.
The goal is not to maximize every chatbot metric. It is to create a system that resolves the right tasks, escalates appropriately, protects users and data, and produces business value that can be explained with evidence.
Start with the use case and the decision you need to make. Then select a small set of business KPIs, define diagnostic metrics for each one, instrument the necessary events, and establish a baseline before optimization begins. That approach turns chatbot analytics from a reporting exercise into a continuous product and operations loop.
 Services Account
Need Help With A Project?
Drop us a line, let’s arrange a discussion
Frequently Asked Questions
The most important chatbot KPIs depend on the chatbot’s purpose. A customer support bot usually needs verified resolution or FCR, deflection, cost per resolved conversation, CSAT, and repeat contact. A sales bot needs qualified lead rate, booking or purchase conversion, pipeline or revenue influenced, and cost per qualified outcome. An internal HR or IT bot needs self-service completion, avoided tickets, time saved, adoption, and repeat request rate. Every business KPI should be supported by diagnostic metrics. For example, FCR may be explained by intent coverage, fallback rate, retrieval quality, latency, escalation, and reopen rate.
A chatbot metric is any measurable value that describes usage, behavior, performance, quality, cost, or risk. A chatbot KPI is a metric or composite measure selected because it represents progress toward a specific business goal. A KPI should have a defined formula, target, owner, review period, and connection to a decision. Fallback rate may be an operational metric used by an AI team. Cost per verified resolution may be a KPI used by support and finance leadership. The same measure can be a KPI in one chatbot program and a supporting metric in another.
Operational metrics such as service errors, non-response, latency, safety events, and sudden fallback changes should be monitored continuously or daily. Chatbot owners and product teams should review intent, resolution, escalation, abandonment, CSAT, and retrieval trends weekly and after major releases. Business impact KPIs such as deflection, conversion, cost per resolution, and time saved are usually more meaningful on a monthly cadence because they need sufficient volume and data from connected systems. Executives can review ROI and strategic scope monthly or quarterly. The correct cadence depends on traffic, risk, and how quickly the team can act on a change.


